HomeVisionXL Object Tracking Plugin
Introduction
The Object Tracking plugin allows the user to select a number of objects to track. The state changes over time of the selected objects will be displayed in one or more graphs as shown below.
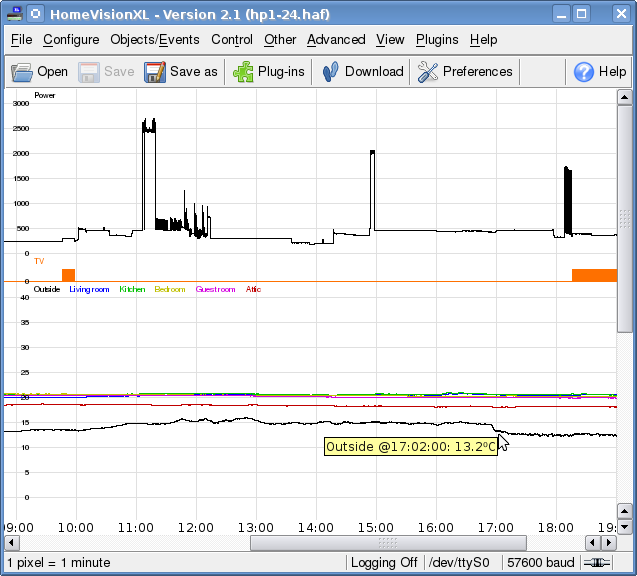
You can click on a line in the graph to get more details about the value of the tracked entity at that point.
As the temperature graph on the bottom of the image shows, a single graph can show multiple traces. This way a number of similar entities can be combined in a single graph, making it very easy to compare the values at any point in time. But as the graph also shows, with multiple traces of similar entities there is a risk that some traces overlap. To make it easier to see a specific trace, you can click on the associated label. This will bring the selected trace to the front. You can also hide individual traces by Control-clicking on the trace label. Simply click on the label to make the trace visible again.
To allow the plug-in to keep track of object state changes, automatic reporting has to be configured.
Configure graphs
The Plugins⇒Object Tracking menu brings up a screen that allows the user to configure the graphs.
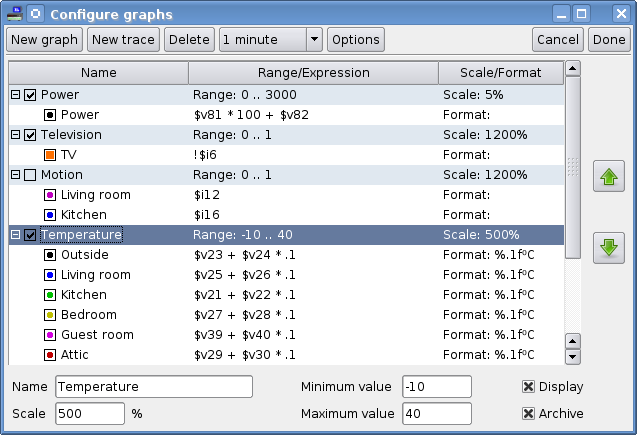
The buttons in the toolbar enable you to add a new graph, add a new trace within a graph, or delete graphs and traces. There is also a button for selecting the display interval. The display interval affects the horizontal scale of the graph. The selected time period corresponds to one pixel. Finally there is button that brings up another dialog where additional options can be configured. This screen is described in more detail later.
Graphs
You can give each graph a name and specify its vertical scale. The scale affects how many pixels are used per unit. 100% corresponds to 1 pixel per unit. For each graph you configure a display range by specifying the minimum and maximum value that you want to be able to show in the graph. Per graph you can select whether it should be displayed on the object tracking view, archived, both, or neither.Traces
Each trace within a graph has an associated label and color. The form of the trace is defined by an expression. An expression is a formula that will calculate the value of the desired property for each point in time based on the values of HomeVision objects at that moment. An object is represented in the expression by a $-sign, followed by a single letter for the object type, and the object number. The following objects types are supported:- x: X-10 module
- f: Flags
- v: Variables
- l: Custom lights
- i: Input ports
- o: Output ports
- a: Analog input ports
- t: Digital temperature sensors
The fill option causes the area between the graph and 0 to be filled with the selected color, as demonstrated in the "TV" graph. This option is most useful for on/off type graphs, but can also be used with other types of graphs.
The Format field may be used to configure how the value is displayed when you click on a graph for details. You can use this field to limit or force the number of decimals on a floating point number. It also allows you to specify the unit of the value. Examples:
%.3g - display the value with 3 significant digits
%dmm - display the value as a decimal number representing millimeters
Options
The Options screen allows you to configure some details about the operation of the object tracking plug-in. The screen has three tabs: General, Archiving, and Noisy objects.General
By default the Object Tracking plug-in creates a new screen in HomeVisionXL's main window and brings it to the front. But if you prefer to display some other plug-in or you are only interested in the archive function of the object tracking plug-in, you can uncheck the "Show tracking screen on startup" option.The Object Tracking plug-in keeps track of nearly all objects, not just the ones used in trace expressions. The advantage is that you can add a trace and immediately also see information about the past. A disadvantage is that the plug-in can start using a lot of memory if it runs for a long time. To limit the memory use you can select when old information will be discarded.
Archiving
Because the Object Tracking plug-in has a limit to the amount of history it can keep, it may be desirable to periodically save the collected data. The Archiving feature can write selected graphs in SVG format to disk at a fixed time every day, or when HomeVisionXL is shut down, or both. You can also select the interval setting to use when saving the graphs.Each time the graphs are written, a sub-directory named after the start time of the graphs (YYYYMMDDHHMM) is created in the selected directory. In that sub-directory SVG files are stored for each graph that has the Archive option switched on. The names of the SVG files are derived from the graph names.
Alternatively, an external command can be executed if something more complicated than only saving the files needs to be done. In this case the command is called with two additional arguments: The start time of the graphs in the same format as the name of the sub-directory and the file name of the SVG image. The SVG data is passed to the standard input of the process.
Noisy objects
As mentioned earlier, the object tracking plug-in doesn't limit the data it stores to only the objects referenced in trace expressions. For each object only the state changes are stored. So a flag that doesn't change state all day takes very little memory. Variables that change frequently on the other hand take up much more memory.The irony is that such a frequently changing variable is probably a temporary variable used to hold some intermediate result in an action. Its value is totally uninteresting and a graph based on the variable would be completely useless. Another example is an unused analog input port. Unless tied to a fixed voltage, these ports will produce a different value nearly every time they are scanned.
The object tracking plug-in can be configured to ignore these noisy objects. If during the first 15 minutes of operation of the tracking plug-in an object's state changes more often than a configured limit, the object will be excluded from further tracking and any state information already collected is deleted. This trick can significantly reduce the amount of memory required by the plug-in.
Interaction with other plug-ins
The plug-in publishes two commands that can be invoked by other plug-ins:- trackgraph name ?interval?
- This command generates an SVG image of the named graph and returns it to
the caller. The interval argument specifies the number of seconds per pixel
to use when generating the graph. The only allowed values are: 1, 5, 10, 30,
60, 120, and 240. If the interval argument is not specified or has an invalid
value it defaults to 60, resulting in 1 minute per pixel.
- tracklevel type num ?time? ?value? ?replace?
- The tracking plug-in knows the history of pretty much all objects. This
may be interesting information for other plug-ins. This command may be used
to extract that information. If the command is called with only an object
type and number, the full history for that object is returned as a list
consisting of alternating timestamps and state values. If a time value is
passed to the command, it returns the state of the object at that time.
Plug-ins may also provide additional state information to the tracking plug-in. For example a plug-in that has access to a round robin database can inject information into the tracking plug-in for times before the plug-in started collecting data. To do that, the plug-in would pass the state value of the object at the specified time in the tracklevel command.
The replace argument determines how the new value will be added to the tracked state for the object. The default value of -1 means the new value will be inserted before any already known state at the same time. A replace argument of 0 or more replaces the nth state change at the specified time. If the replace argument is larger than the known state changes at the specified time, the new value is added as the final state value at that time.
Here are the results if, from this starting point, you add a state value of 7 at time 1284300000 with different replace arguments:
- tracklevel var 42 1284300000 7
- … 1284299990 4 1284300000 7 1284300000 2 1284300000 9 1284300000 5 1284300010 8 …
- tracklevel var 42 1284300000 7 0
- … 1284299990 4 1284300000 7 1284300000 9 1284300000 5 1284300010 8 …
- tracklevel var 42 1284300000 7 1
- … 1284299990 4 1284300000 2 1284300000 7 1284300000 5 1284300010 8 …
- tracklevel var 42 1284300000 7 2
- … 1284299990 4 1284300000 2 1284300000 9 1284300000 7 1284300010 8 …
- tracklevel var 42 1284300000 7 3
- … 1284299990 4 1284300000 2 1284300000 9 1284300000 5 1284300000 7 1284300010 8 …
Web plug-in
The web plug-in is able to include SVG images from the object tracking plug-in in the pages it produces. To use this feature, include a HV:Image tag in your page. For example:Additional notes
Web browsers
SVG has broad support now and it will work properly on any modern web browser.Javascript
The individual traces in a graph have an id that matches the trace label. This allows the graph, when viewed using a web browser, to be manipulated using javascript as demonstrated here.