HomeVisionXL Debug Plug-in
When developing plug-ins it can be useful to put some debugging commands in the code that output some text indicating that a certain point in the code has been reached or for dumping the value of some variable. Especially on Microsoft Windows this is a bit difficult because the standard output of the plug-in doesn't show up anywhere. In these situations the debug plug-in can help out. When the plug-in is enabled, a screen appears that other plug-ins can use for sending their output. In those other plug-ins include the following code:
hvImport debug
After that you can use the debug command to send a string to the debug window. Example:
debug "The value of variable foo is: $foo"
Normally text will be displayed in black, but you can differentiate message types by specifying a color as a second argument to the debug call. Example:
debug "Error: $errmsg" red
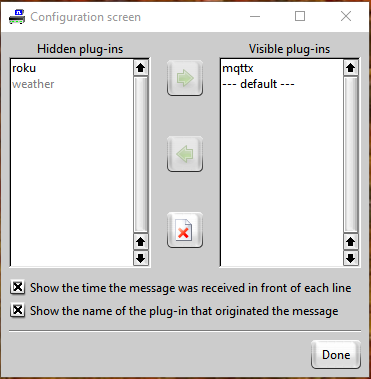
To be able to tell which plug-in originated a specific message, the debug plug-in can display the name of the plug-in in front of each message. In many cases it can be useful to know at what time a message was generated, so the debug plug-in can also add a timestamp to the message. A configuration screen allows the user to enable or disable each of these two options. Additionally the user can select for each plug-in whether to display, hide or ignore the messages.
The configuration screen and the features it controls are only available if the debug plug-in is used with HomeVisionXL version 2.0b13 or higher. The configuration screen can be accessed through the context-menu on the output screen of debug plug-in.

Only plug-ins that have ever sent debugging information will be listed and can be individually placed into either the hidden or visible category. The "--- default ---" entry controls if new and therefor currently unlisted plug-ins will start out hidden or visible.